Last night, our render pipeline encountered a strange symptom: ComfyUI was still responding to HTTP normally, the job queue was still moving, but the GPU wasn't consuming any work at all — not even one percent. The entire render batch sat idle with no clean error message to look at. This note tells the story of the "wedge" condition and the automatic recovery ladder we built into the pipeline.
The Wedge Symptom We Encountered
Three signals appeared simultaneously:
- The server process was still alive, responding to HTTP requests on every endpoint
- The job queue "appeared" to be moving, but no renders were flowing out
- GPU utilization (gpu_util) stayed at zero for over 60 seconds continuously, even though the queue had jobs waiting
This kind of symptom is more dangerous than a complete crash, because monitoring systems that only check "is it responding?" will see everything as normal, even though production has ground to a halt.
Detection Method: Don't Trust HTTP Alone
The key lesson is that health checks must measure "is work flowing?" not just "is the server responding?" We therefore added monitoring of gpu_util — if the queue has jobs but gpu_util stays at zero for over 60 seconds, the system considers it a wedge and begins recovery steps immediately.
The COMFY_HEAL Ladder
When a wedge is detected, the system climbs the recovery ladder step by step, with a 180-second timeout per cycle to prevent an endless restart loop:
| Step | Action | Condition |
|---|---|---|
| 1 | Restart only the wedged process (identified by PID, not name) | Wedge detected on primary GPU |
| 2 | Fail over to backup GPU on same machine | Still not working after restart |
| 3 | Safely cancel entire job batch, alert team | First two steps failed |
The most critical point is the restart itself — we must terminate only our own process, identified by PID. We never kill by program name, because multiple services with similar names run on the same machine.
Test Results
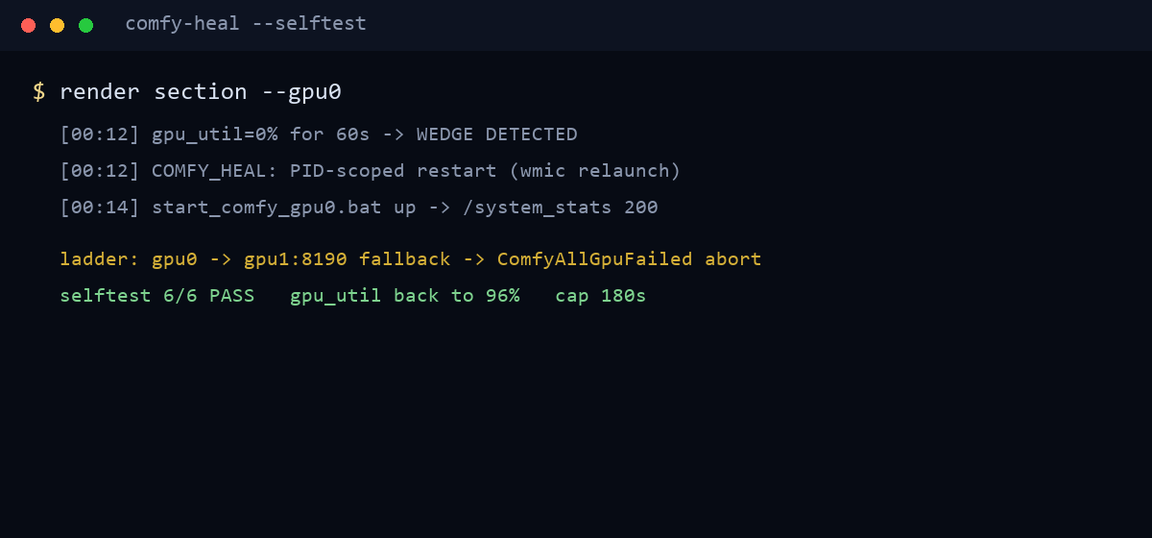
- Offline selftests passed all 6/6 cases (detection, restart, re-check, failover, timeout, safe cancel)
- The restart mechanism has been proven in real production incidents during clip rendering — stuck jobs were re-rendered and aired on schedule
- After recovery, gpu_util returned to 96% within two minutes
Next Steps
The next step is to roll out this "measure work flow" health check approach to all other services in the fleet, including weekly wedge statistics to see if this symptom correlates with specific job types — stay tuned for the next Lab Notes post.